

Saurabh Jain
-
Posts
1,726 -
Joined
-
Last visited
-
Days Won
61
Content Type
Profiles
Forums
Gallery
Downloads
Blogs
Events
Online Conference
The Excel dictionary
Power Query M function dictionary
Posts posted by Saurabh Jain
-
-
I thought, lets keep it parallel activity, in tutorials, we will start with very basics....to build the foundation...such as even moving within worksheets
As we are waiting for new members to join - Lets begin with a Preliminary Exercise
Question. 1.
In my class, I give five homework assignments, each worth 25 points, and three exams, each worth 100 points. I currently compute a student’s final grade by giving 75 percent of the weight to exams and 25 percent to homework.Set up a spreadsheet to calculate the final grade for a student that allows you to change the weight given to exams.
Give a try
Do not post your the solutions... the excel file... just share your experience...
-
Welcome sir...
What subjects are you taking
-
Welcome @CIARA
I have been teaching macros .. and groat to see you on board
Here focus will be on excel... and yes... if things works right.... vba then we will look for M as well
I am sure you will love to be part of the course...
In between... we will like to ask you to share your data work .. the tasks you perform... challenges
-
Welcome @Kiril
I am sure you will enjoy the course
and in later half , we will love to hear more about your work and challenges faced by you make the things more productive....
-
 1
1
-
-
I am working on preparing the content.... The course will be live soon...
Meanwhile I expect at least 100 students to participate.... and to start some introductions
-
-
@Saurabh Jain is a mechanical engineer graduate & management professional.
He started his journey of excel in production planning department, where he used to play with pivot tables to design the required reports.
Has worked in various companies, before starting delivering VBA Macro training
- 1 Production Planning
- 2 Energy Modelling
- 3 Project Management
- 3 Business Intelligence in Evaluserve for oil & gas strategic division
- 5 Enterprise Risk Management in JSW Steels
More about him soon in same post
His linkedin profile https://www.linkedin.com/in/saurabhjain82/
-
What complex functions do I don't believe that anybody Feels the way I do, about Excel Your fate, you’re gonna graduate And find yourself a job to do These skills that we’ve all learned Will be there to see you through I don't believe that anybody Can get ahead in life, without Excel Cause vlookup can help you merge your data You can slice and dice our numbers in pivot table There are many things that I wish I Could have taught to you but you’ll learn in time So trust me, Excel was a skill that saved me And after all, Excel is wonderful COUNTIF, SUMIF, AVERAGEIF or Nested IF will do Remove Dups and Data Validate Are some tricks that you will use I don't believe that anybody Should go a single day, without Excel The FORCAST function models out and predicts Your boss will be amaze by these Excel tricks There are many things that I wish I Could have taught to you but you’ll learn in time So trust me, Excel was a skill that saved me And after all, Excel is wonderful So trust me, Excel was a skill that saved me And after all, Excel is wonderful
-
Please share your cases where you are using power query ?

-
6 Predictions about Data Science, Machine Learning, and AI for 2018
By William Vorhies
Summary: Here are our 6 predictions for data science, machine learning, and AI for 2018. Some are fast track and potentially disruptive, some take the hype off over blown claims and set realistic expectations for the coming year.
It’s that time of year again when we do a look back in order to offer a look forward. What trends will speed up, what things will actually happen, and what things won’t in the coming year for data science, machine learning, and AI.
We’ve been watching and reporting on these trends all year and we scoured the web and some of our professional contacts to find out what others are thinking. There are only a handful of trends and technologies that look to disrupt or speed ahead. These are probably the most interesting in any forecast. But it also valuable to discuss trends we think are a tad overblown and won’t accelerate as fast as some others believe. So with a little of both, here’s what we concluded.
Prediction 1: Both model production and data prep will become increasingly automated. Larger data science operations will converge on a single platform (of many available). Both of these trends are in response to the groundswell movement for efficiency and effectiveness. In a nutshell allowing fewer data scientists to do the work of many.
The core challenge is that there remains a structural shortage of data scientists. Whenever a pain point like this emerges we expect the market to respond and these two elements are its response. Both come at this from slightly different angles.
The first is that although the great majority of fresh new data scientists have learned their trade in either R or Python that having a large team freelancing directly in code is extremely difficult to manage for consistency and accuracy, much less to debug.
All the way back in their 2016 Magic Quadrant for Advanced Analytic Platforms, Gartner called this outand wouldn’t even rate companies that failed to provide a Visual Composition Framework (drag-and-drop elements of code) as a critical requirement. Gartner is very explicit that working in code is incompatible with the large organization’s need for quality, consistency, collaboration, speed, and ease of use.
Langley Eide, Chief Strategy Officer at Alteryx offered this same prediction, that “data science will break free from code dependence. In 2018, we’ll see increased adoption of common frameworks for encoding, managing and deploying Machine Learning and analytic processes. The value of data science will become less about the code itself and more about the application of techniques. We’ll see the need for a common, code-agnostic platform where LOB analysts and data scientists alike can preserve existing work and build new analytics going forward.”
The second element of this prediction which I do believe is disruptive in its implications is the very rapid evolution of Automated Machine Learning. The first of these appeared just over a year ago and I’ve written several times about the now 7 or 8 competitors in this field such as DataRobot, Xpanse Analytics, and PurePredictive. These AML platforms have achieved one-click-data-in-model-out convenience with very good accuracy. Several of these vendors have also done a creditable job of automating data prep including feature creation and selection.
Gartner says that by 2020, more than 40% of data science tasks will be automated. Hardly a month goes by without a new platform contacting me wanting to be recognized on this list. And if you look into the clients many have already acquired you will find a very impressive list of high volume data science shops in insurance, lending, telecoms, and the like.
Even large traditional platforms like SAS offer increasingly automated modules for high volume model creation and maintenance, and many of the smaller platforms like BigML have followed suite with greatly simplified if not fully automated user interfaces.
Prediction 2: Data Science continues to develop specialties that mean the mythical ‘full stack’ data scientist will disappear.
This prediction may already have come true. There may be some smaller companies that haven’t yet got the message but trying to find a single data scientist, regardless of degree or years of experience, who can do it all just isn’t in the cards.
First there is the split between specialists in deep learning and predictive analytics. It’s possible now to devote your career to just CNNs or RNNs, work in Tensorflow, and never touch or understand a classical consumer preference model.
Similarly, the needs of different industries have so diverged in their special applications of predictive analytics that industry experience is just as important as data science skill. In telecoms and insurance it’s about customer preference, retention, and rates. In ecommerce it’s about recommenders, web logs, and click streams. In banking and credit you can make a career in anomaly detection for fraud and abuse. Whoever hires you is looking for these specific skills and experiences.
Separately there is the long overdue spinoff of the Data Engineer from the Data Scientist. This is identification of a separate skills path that only began to be recognized a little over a year ago. The skills the data engineer needs to set up an instance in AWS, or implement Spark Streaming, or simply to create a data lake are different from the analytical skills of the data scientist. Maybe 10 years ago there were data scientists who had these skills but that’s akin to the early days of personal computers when some early computer geeks could actually assemble their own boxes. Not anymore.
Prediction 3: Non-Data Scientists will perform a greater volume of fairly sophisticated analytics than data scientists.
As recently as a few years ago the idea of the Citizen Data Scientist was regarded as either humorous or dangerous. How could someone, no matter how motivated, without several years of training and experience be trusted to create predictive analytics on which the financial success of the company relies?
There is still a note of risk here. You certainly wouldn’t want to assign a sensitive analytic project to someone just starting out with no training. But the reality is that advanced analytic platforms, blending platforms, and data viz platforms have simply become easier to use, specifically in response to the demands of this group of users. And why have platform developers paid so much attention? Because Gartner says this group will grow 5X as fast as the trained data scientist group, so that’s where the money is.
There will always be a knowledge and experience gap between the two groups, but if you’re managing the advanced analytics group for your company you know about the drive toward ‘data democratization’ which is a synonym for ‘self-service’. There will always be some risk here to be managed but a motivated LOB manager or experienced data analyst who has come up the learning curve can do some pretty sophisticated things on these new platforms.
Langley Eide, Chief Strategy Officer at Alteryx suggests that we think of these users along a continuum from no-code to low-code to code-friendly. They are going to want a seat at our common analytic platforms. They will need supervision, but they will also produce a volume of good analytic work and at very least can leverage the time and skills of your data scientists.
Prediction 4: Deep learning is complicated and hard. Not many data scientists are skilled in this area and that will hold back the application of AI until the deep learning platforms are significantly simplified and productized.
There’s lots of talk about moving AI into the enterprise and certainly a lot of VC money backing AI startups. But almost exclusively these are companies looking to apply some capability of deep learning to a real world vertical or problem set, not looking to improve the tool.
Gartner says that by 2018, deep neural networks will be a standard component of 80% of data scientists’ tool boxes. I say, I’ll take that bet, that’s way too optimistic.
The folks trying to simplify deep learning are the major cloud and DL providers, Amazon, Microsoft, Google, Intel, NVDIA, and their friends. But as it stands today, first good luck finding a well-qualified data scientists with the skills to do this work (have you seen the salaries they have to pay to attract these folks?).
Second, the platforms remain exceedingly complex and expensive to use. Training time for a model is measured in weeks unless you rent a large number of expensive GPU nodes, and still many of these models fail to train at all. The optimization of hyperparameters is poorly understood and I expect some are not even correctly recognized as yet.
We’ll all look forward to using these DL tools when they become as reasonable to use as the other algorithms in our tool kit. The first provider to deliver that level of simplicity will be richly rewarded. It won’t be in 2018.
Prediction 5: Despite the hype, penetration of AI and deep learning into the broader market will be relatively narrow and slower than you think.
AI and deep learning seems to be headed everywhere at once and there are no shortages of articles on how or where to apply AI in every business. My sense is that these applications will come but much slower than most might expect.
First, what we understand as commercially ready deep learning driven AI is actually limited to two primary areas, text and speech processing, and image and video processing. Both these areas are sufficiently reliable to be commercially viable and are actively being adopted.
The primary appearance of AI outside of tech will continue to be NLP Chatbots, both as input and output to a variety of query systems ranging from customer service replacements to interfaces on our software and personal devices. As we wrote in our recent series on chatbots, in 2015 only 25% of companies had even heard of chatbots. By 2017, 75% had plans to build one. Voice and text is rapidly becoming a user interface of choice in all our systems and 2018 will see a rapid implementation of that trend.
However, other aspects of deep learning AI like image and video recognition, outside of facial recognition is pretty limited. There will be some adoption of facial and gesture recognition but those aren’t capabilities that are likely to delight customers at Macy’s, Starbucks, or the grocery store.
There are some interesting emerging developments in using CNNs and RNNs to optimize software integration and other relatively obscure applications not likely to get much attention soon. And of course there are our self-driving cars based on reinforcement learning but I wouldn’t camp out at your dealership in 2018.
Prediction 6: The public (and the government) will start to take a hard look at social and privacy implications of AI, both intended and unintended.
This hasn’t been so much a tsunami as a steadily rising tide that started back with predictive analytics tracking our clicks, our locations, and even more. The EU has acted on its right to privacy and the right to be forgotten now documented in their new GDPR regs just now taking effect.
In the US the good news is that the government hasn’t yet stepped in to create regulations this draconian. Yes there have been restrictions placed on the algorithms and data we can use for some lending and health models in the name of transparency. This also makes these models less efficient and therefore more prone to error.
Also, the public is rapidly realizing that AI is not currently able to identify rare events with sufficient accuracy to protect them. After touting their AI’s ability to spot fake news, or to spot and delete hate speech or criminals trolling for underage children, Facebook, YouTube, Twitter, Instagram, and all the others have been rapidly fessing up that the only way to control this is with legions of human reviewers. This does need to be solved.
Still, IMHO on line tracking and even location tracking through our personal devices is worth the intrusion in terms of the efficiency and lower cost it creates. After all, the materials those algorithms present to you on line are more tailored to your tastes and since it reduces advertising cost, should also reduce the cost of what you buy. You can always opt out or turn off the device. However, this is small beer compared to what’s coming.
Thanks largely to advances in deep learning applied to image recognition, researchers have recently demonstrated peer-reviewed and well-designed data science studies that show that they can determine criminals from non-criminals, and gays from straights with remarkable levels of accuracy based only on facial recognition.
The principle issue is that while you can turn off your phone or opt out of on-line tracking that the proliferation of video cameras tracking and recording our faces makes it impossible to opt out of being placed in facial recognition databases. There have not yet been any widely publicized adverse impacts of these systems. But this is an unintended consequence waiting to happen. It could well happen in 2018.
-
 1
1
-
-
What are your Predictions about Data Science, Machine Learning, AI & Analytics for 2018
-
Microsoft Excel is an amazing piece of software, and even regular users might not be getting as much out of it as they can. Improve your Excel efficiency and proficiency with these basic shortcuts and functions that absolutely everyone needs to know.
1. Jump from worksheet to worksheet with Ctrl + PgDn and Ctrl + PgUp

2. Jump to the end of a data range or the next data range with Ctrl + Arrow
Of course you can move from cell to cell with arrow keys. But if you want to get around faster, hold down the Ctrl key and hit the arrow keys to get farther:

3. Add the Shift key to select data
Ctrl + Shift +Arrow will extend the current selection to the last nonblank cell in that direction:

4. Double click to copy down
To copy a formula or value down the length of your data set, you don't need to hold and drag the mouse all the way down. Just double click the tiny box at the bottom right-hand corner of the cell:

5. Use shortcuts to quickly format values
For a number with two decimal points, use Ctrl + Shift + !. For dollars use Ctrl + Shift + $. For percentages it's Ctrl + Shift + %. The last two should be pretty easy to remember:

6. Lock cells with F4
When copying formulas in Excel, sometimes you want your input cells to move with your formulas BUT SOMETIMES YOU DON'T. When you want to lock one of your inputs you need to put dollar signs before the column letter and row number. Typing in the dollar signs is insane and a huge waste of time. Instead, after you select your cell, hit F4 to insert the dollar signs and lock the cell. If you continue to hit the F4 key, it will cycle through different options: lock cell, lock row number, lock column letter, no lock.

7. Summarize data with CountIF and SumIF
CountIF will count the number of times a value appears in a selected range. The first input is the range of values you want to count in. The second input is the criteria, or particular value, you are looking for. Below we are counting the number of stories in column B written by the selected author:
COUNTIF(range,criteria)

SumIF will add up values in a range when the value in a corresponding range matches your criteria. Here we want to count the total number of views for each author. Our sum range is different from the range with the authors' names, but the two ranges are the same size. We are adding up the number of views in column E when the author name in column B matches the selected name.
SUMIF(range,criteria,sum range)

8. Pull out the exact data you want with VLOOKUP
VLOOKUP looks for a value in the leftmost column of a data range and will return any value to the right of it. Here we have a list of law schools with school rankings in the first column. We want to use VLOOKUP to create a list of the top 5 ranked schools.
VLOOKUP(lookup value,data range,column number,type)
The first input is the lookup value. Here we use the ranking we want to find. The second input is the data range that contains the values we are looking up in the leftmost column and the information we're trying to get in the columns to the right. The third input is the column number of the value you want to return.
We want the school name, and this is in the second column of our data range. The last input tells Excel if you want an exact match or an approximate match. For an exact match write FALSE or 0.

9. Use & to combine text strings
Here we have a column of first names and last names. We can create a column with full names by using &. In Excel, & joins together two or more pieces of text. Don't forget to put a space between the names. Your formula will look like this =[First Name]&" "&[Last Name]. You can mix cell references with actual text as long as the text you want to include is surrounded by quotes:

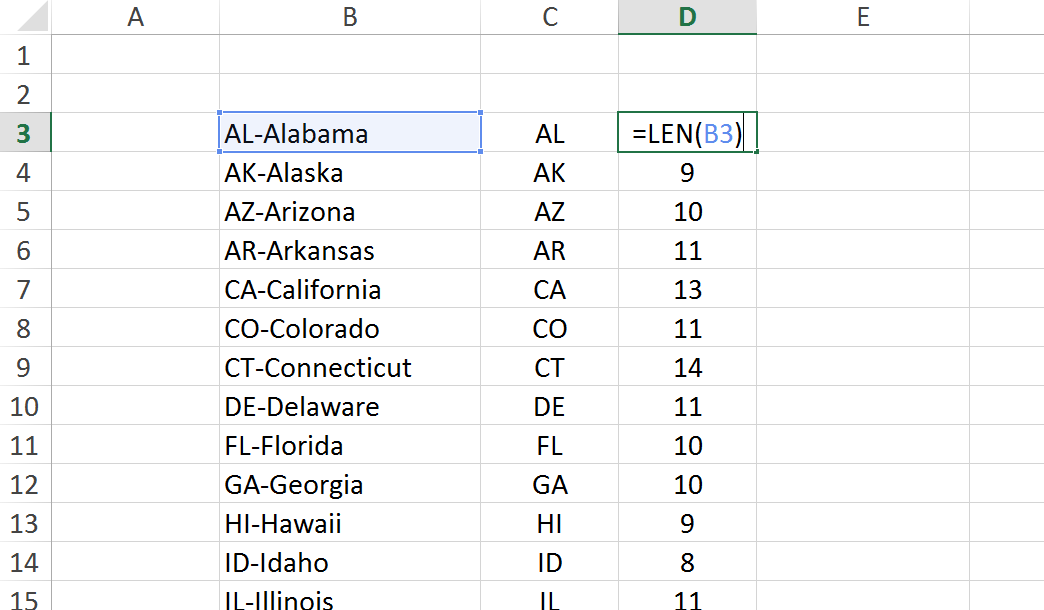
10. Clean up text with LEFT, RIGHT and LEN
These text formulas are great for cleaning up data. Here we have state abbreviations combined with state names with a dash in between. We can use the LEFT function to return the state abbreviation. LEFT grabs a specified number of characters from the start of a text string. The first input is the text string. The second input is the number of characters you want. In our case, we want the first two characters:
LEFT(text string, number of characters)

If you want to pull the names of the states out of this text string you have to use the RIGHT function. RIGHT grabs a number of characters from the right end of a text string.
But how many characters on the right do you want? All but three, since the state names all come after the state's two-letter abbreviation and a dash. This is where LEN comes in handy. LEN will count the number of characters or length of the text string.
LEN(text string)

Now you can use a combination of RIGHT and LEN to pull out the state names. Since we want all but the first three characters, we take the length of our string, subtract 3, and pull that many characters from the right end of the string:
RIGHT(text string,number of characters)

11. Generate random values with RAND
You can use RAND() function to generate a random value between 0 and 1. D0 not include any inputs, just leave the parentheses empty. New random values will be generated every time the workbook recalculates. You can force it to recalculate by hitting F9. But be careful. It also recalculates when you make other changes to the workbook:
RAND()

-
1
-
-
Hi Friends,
This is my first video tutorial for VLookUp. Hope you all will like it
Download the exercise file
-
1
-
-
In the overall knowledge discovery process, before data mining itself, data preprocessing plays a crucial role. One of the first steps concerns the normalization of the data. This step is very important when dealing with parameters of different units and scales. For example, some data mining techniques use the Euclidean distance. Therefore, all parameters should have the same scale for a fair comparison between them.
Two methods are usually well known for rescaling data. Normalization, which scales all numeric variables in the range [0,1]. One possible formula is given below:
On the other hand, you can use standardization on your data set. It will then transform it to have zero mean and unit variance, for example using the equation below:
Both of these techniques have their drawbacks. If you have outliers in your data set, normalizing your data will certainly scale the “normal” data to a very small interval. And generally, most of data sets have outliers. When using standardization, your new data aren’t bounded (unlike normalization).
So my question is what do you usually use when mining your data and why?
-
1
-
-
 There are tons of shortcuts for Excel out there—here’s a list of 200 for Excel 2013 alone. But trying to learn such a large number can be overwhelming, confusing, and ultimately inefficient.
Instead, we’ve put together a list of 15 shortcuts that will be immediately useful for most users. This keyboard shortcut lists includes quick ways to format cells, navigate the program, and carry out a few operations.
The list is based on Excel 2016, but most will also work on Excel 2013. When that’s not the case we’ve noted it.
-
 Keyboard access to the ribbon: Similar to the Vim-inspired add-ons for Chrome andFirefox, Excel 2013 and 2016 have a feature called Key Tips. When Key Tips appears by pressing Alt the Ribbon menu is overlaid with letters. Pressing a letter launches the corresponding menu item.
- Ctrl + PgDn: Switch between worksheet tabs, moving left to right.
- Ctrl + PgUp: Switch between worksheet tabs, moving right to left.
- F12: Display the “Save As” dialog.
- Ctrl + Shift + $: (Excel 2016) Current cell formatted as currency, with two decimal places and negative numbers in parentheses.
- Ctrl + Shift + %: (Excel 2016) Current cell formatted as percentage with no decimal places.
- Ctrl + Shift + #: (Excel 2016) Current cell formatted as date with day, month, year.
- Ctrl + Shift + “:”: Insert current time.
- Ctrl + Shift + “;”: Insert current date.
- F4: Repeats the last command or action, if possible.
- Shift + Arrow key: Extends your current cell selection by one addition cell in the direction specified.
- Ctrl + F1: Display or hide the Ribbon.
- Alt + Shift + F1: Insert a new worksheet tab.
- Ctrl + F4: Close the current workbook.
- Ctrl + D: Launches the Fill Down command for the selected cells below. Fill Down copies contents and format of the topmost cell in the column.
-
1
-
-
 Power users love to talk about how powerful and awesome Excel is, what with its Pivot Tables, nested formulas, and Boolean logic. But many of us barely know how to find the Autosum feature, let alone use Excel’s functions to create powerful formulas.
If that’s you, here are 15 handy Excel functions that will get you well on your way to spreadsheet mastery.
=SUM()
The first function anyone should know tells Excel to carry out basic arithmetic. Let’s say you wanted the numbers in cell A2 and cell B2 to be added together in cell B3. All you’d do is enter =SUM into B3, click the =SUM entry in the pop-up that appears, Control + Click in cell A2 and B2 to highlight both, then hit Enter. In an instant you’d see sum of the two cells appear.
You can use this function, and most of the functions listed here, to encompass as many cells as you require—just select all the ones you need included.
=AVERAGE
Average does exactly what it says and works similarly to SUM. If you have a worksheet containing your monthly earnings over the past year in columns A2 through A13, type =AVERAGE(A2:A13) into A14 to get the average.
Again, you can also use your mouse cursor to click-and-drag highlight a range of cells, or use Control + Click to handpick individual cells.
=MIN()
If you need to find the smallest number in a range of cells, MIN can help you do that. Using =MIN(B3:B39) will give you the smallest number contained in those cells.
=MAX()
Max is the counterpart to MIN and does the opposite showing you the largest number contained in a range of cells.
=TRIM()
If you copy text from another program into Excel you can often end up with excess whitespace that turns your spreadsheet into a visual horror. TRIM can help you clean it up.
TRIM can only deal with text from a single cell. So start by cleaning up the text in cell B1 by typing =TRIM(B1) into cell C1, for example, and then repeat the function for any other cells you need tidied up.
If you’re looking to clean up line breaks, try CLEAN instead of TRIM.
=COUNT()
If you need to know how many cells in a given range contain numbers, don’t bother counting by hand—just use the COUNT function. If you have a mix of numbers and text in cells A1-A20, for example, type into cell A21 =COUNT(A1:20) and you’ll have the answer in no time.
=COUNTA()
Similar to the above example, you can use =COUNTA() to count the number of cells in a given range that contain characters such as numbers, text, or symbols.
=LEN()
If you want to count the number of characters in a single cell, including white spaces, check out LEN. Want to know how many characters are in cell A1? Just type =LEN(A1) into a different cell and you’ll find out.
=CONCATENATE()
This takes data from two cells and turns it into one. Check out our previous look at Excel functions to see how this can be useful.
=DAYS()
Want to know the number of days between two dates in a spreadsheet? If you had for example, September 5, 2015 in cell A4 and December 27, 2015 in A5 just use =DAYS(A5, A4) to get the answer. (Reversing the order of cells would give you a positive number).
=NETWORKDAYS()
Knowing the number of days is great, but if you need to know how many work days that range encompasses, turn to NETWORKDAYS (that’s ‘net work days’) instead. This function uses the same format as DAYS, but you need to use an ascending cell order to get a non-negative number. So =NETWORKDAYS(A4, A5) will give you 80 and not -80.
=SQRT()
Need to know the square root of 1764? Type =SQRT(1764) into a cell, hit Enter, and you’ll find the answer to life, the universe, and everything—including the example formula.
=NOW()
Want to see the current date and time whenever you open a particular worksheet? Type =NOW() into the cell where you want the date and you’re done. If you want to see a future date from right now, you can use something like =NOW()+32. The now function does not take any arguments so don’t put anything in between the brackets.
=ROUND()
As its name suggests, this function lets you round off numbers. ROUND requires two arguments: a number or cell, and the number of digits to round to. If you have the number 231.852645 in A1, for example, =ROUND(A1, 0) gives you 232, =ROUND(A1, 1) gives you 232.9, and =ROUND(A1, -1) returns 230.
=ROUNDUP(), =ROUNDDOWN()
If you want more direct control over rounding up or down there are functions for that too. ROUNDUP and ROUNDDOWN use exactly the same argument format as ROUND.
-
1
-
-
 For data analysis and interactive, exploratory computing and data visualization, Python will inevitably draw comparisons with the many other domain-specific open source and commercial programming languages and tools in wide use, such as R, MATLAB, SAS, Stata, and others. In recent years, Python’s improved library support (primarily pandas) has made it a strong alternative for data manipulation tasks. Combined with Python’s strength in general purpose programming, it is an excellent choice as a single language for building data-centric applications
Solving the “Two-Language” Problem
In many organizations, it is common to research, prototype, and test new ideas using a more domain-specific computing language like MATLAB or R then later port those ideas to be part of a larger production system written in, say, Java, C#, or C++. What people are increasingly finding is that Python is a suitable language not only for doing research and prototyping but also building the production systems, too. I believe that more and more companies will go down this path as there are often significant organizational benefits to having both scientists and technologists using the same set of programmatic tools.
Essential Python Libraries
For those who are less familiar with the scientific Python ecosystem and the libraries used in data analysis. I present the following overview of some libraries
1. NumPy
 NumPy, short for Numerical Python, is the foundational package for scientific computing in Python. It provides, among other things
- A fast and efficient multidimensional array object ndarray
- Functions for performing element-wise computations with arrays or mathematical operations between arrays
- Tools for reading and writing array-based data sets to disk
- Linear algebra operations, Fourier transform, and random number generation
- Tools for integrating connecting C, C++, and Fortran code to Python
Beyond the fast array-processing capabilities that NumPy adds to Python, one of its primary purposes with regards to data analysis is as the primary container for data to be passed between algorithms. For numerical data, NumPy arrays are a much more efficient way of storing and manipulating data than the other built-in Python data structures. Also, libraries written in a lower-level language, such as C or Fortran, can operate on the data stored in a NumPy array without copying any data.
2. pandas
 pandas provides rich data structures and functions designed to make working with structured data fast, easy, and expressive. It is, as you will see, one of the critical ingredients enabling Python to be a powerful and productive data analysis environment. The primary object in pandas that will be used is the DataFrame, a two dimensional tabular, column-oriented data structure with both row and column labels:
pandas combines the high performance array-computing features of NumPy with the flexible data manipulation capabilities of spreadsheets and relational databases (such as SQL). It provides sophisticated indexing functionality to make it easy to reshape, slice and dice, perform aggregations, and select subsets of data.
For financial users, pandas features rich, high-performance time series functionality and tools well-suited for working with financial data. In fact, I initially designed pandas as an ideal tool for financial data analysis applications. For users of the R language for statistical computing, the DataFrame name will be familiar, as the object was named after the similar R data.frame object. They are not the same, however; the functionality provided by data.frame in R is essentially a strict subset of that provided by the pandas DataFrame. While this is a book about Python, I will occasionally draw comparisons with R as it is one of the most widely-used open source data analysis environments and will be familiar to many readers. The pandas name itself is derived from panel data, an econometrics term for multidimensional structured data sets, and Python data analysis itself.
3. matplotlib
 matplotlib is the most popular Python library for producing plots and other 2D data visualizations. It was originally created by John D. Hunter (JDH) and is now maintained by a large team of developers. It is well-suited for creating plots suitable for publication. It integrates well with IPython (see below), thus providing a comfortable interactive environment for plotting and exploring data. The plots are also interactive; you can zoom in on a section of the plot and pan around the plot using the toolbar in the plot window.
4. IPython
 IPython is the component in the standard scientific Python toolset that ties everything together. It provides a robust and productive environment for interactive and exploratory computing. It is an enhanced Python shell designed to accelerate the writing, testing, and debugging of Python code. It is particularly useful for interactively working with data and visualizing data with matplotlib. IPython is usually involved with the majority of my Python work, including running, debugging, and testing code. Aside from the standard terminal-based IPython shell, the project also provides
- A Mathematica-like HTML notebook for connecting to IPython through a web browser (more on this later). •
- A Qt framework-based GUI console with inline plotting, multiline editing, and syntax highlighting •
- An infrastructure for interactive parallel and distributed computing
5. SciPy
 SciPy is a collection of packages addressing a number of different standard problem domains in scientific computing. Here is a sampling of the packages included:
- scipy.integrate: numerical integration routines and differential equation solvers
- scipy.linalg: linear algebra routines and matrix decompositions extending beyond those provided in numpy.linalg.
- scipy.optimize: function optimizers (minimizers) and root finding algorithms
- scipy.signal: signal processing tools
- scipy.sparse: sparse matrices and sparse linear system solvers
- scipy.special: wrapper around SPECFUN, a Fortran library implementing many common mathematical functions, such as the gamma function
- scipy.stats: standard continuous and discrete probability distributions (density functions, samplers, continuous distribution functions), various statistical tests, and more descriptive statistics
- scipy.weave: tool for using inline C++ code to accelerate array computations
Together NumPy and SciPy form a reasonably complete computational replacement for much of MATLAB along with some of its add-on toolboxes.
-
1
-
How to use pivot tables in Excel and that has made all the difference. It enabled me to take a series of data and analyze it in a variety of different ways rather than waiting for a programmer to create a static report. As I was establishing KPIs for my company, this helped me make sense of the data.
This really saved incredible amounts of time and I started enjoyed playing with data.
Sharing with you the ten basic formulas and functions that one can’t live without when it comes to building reports to track the KPIs that are essential to managing their programs. This isn’t meant to be a tutorial but more of a “hey, did you know that you can do that in Excel or Google Sheets?”

Here are ten that you should add to your repertoire if you haven’t already.
1. Filter
 Filtering allows you to quickly sort any column and include/exclude rows containing certain data. For example, if you have a list of all of your phone calls for the month, you can use filtering to only display the calls handled by certain agents.
2. Conditional Formatting
 Conditional Formatting is a great way to add visuals to your spreadsheets based on the data. For example, if you want to rank a set of data, you can have all rows within a certain parameter be one color and anything outside of that parameter another color. It’s great for seeing where you’re hitting your goals and where you might need to improve.
3 Format Painter
 The format painter is a simple tool that allows you to copy just the formatting from a certain spreadsheet and quickly apply it to a new set of cells.
4. Date
The DATE function is incredibly useful in Excel. It’s a common thing to have a bunch of rows with dates but it can be difficult to group them by month. You can quickly create a column for month next to your date column by using this formula:
=DATE(YEAR(A2),MONTH(A2),1)
A2 represents the cell that has the date in it. If the date in that cell looks like 2016-04-03 the month cell will look like 2016-04-01. Regardless of the date, the month will display the first day of each month and now you can quickly filter or group in your pivot table by month.
Bonus: Once you do this in your first cell, double click in the bottom right hand corner of that cell and it will copy the formula all the way to the bottom of your spreadsheet. You don’t have to write that formula 25,000 times. Win.
5. Dollar sign
 The dollar sign is an important little symbol to remember in your formulas. In the previous point, Excel has the ability to customize the formula in the cell relative to the row it’s in. Perhaps you’re doing a formula where you want to multiply the cells in a particular column by a value in another single cell. The dollar sign turns off that relativity and makes sure that the cell number doesn’t change in your formula. So your formula might look something like :
=A2*$D$16
If you copy that formula to the next cell in the column, the formula will look like:
=B2*$D$16
6. Lookup & HLookup
Learn this formula and you will really feel like an Excel wizard. This allows you to grab data from another sheet using a common identifier. For example, you may have one sheet that has all of your data for your support tickets for the month including the name of the agent who handled the ticket. You’d really like to group ticket results by the team the agents work on. In another sheet, you can create a simple, two-column sheet that has the name of the agent and the team they are on.
Once you have that sheet created, go back to your main sheet and create a “team” column. In this case you will use VLOOKUP because it’s vertical. HLOOKUP is if your data is laid out horizontally. The VLOOKUP will look up the name of the agent and match it with the name on the other sheet and fill in the corresponding team name. A formula might look like this:
=VLOOKUP(A2,’OtherSheet’!$A$1:$B$25,2,FALSE)
Note that the aforementioned dollar signs are often really useful in this formula.
7. Data Validation
 Data Validation allows you to create cool things like drop down lists in a cell. Consider a time where you had to enter “yes” or “no” in a certain column or possibly a wider range of options. A drop down list allows you to quickly select from the options you want in a couple clicks rather than several key strokes and it ensures consistent formatting.
8. Sum, Average, Count
These simple functions are great to remember so you don’t have to hunt around for the function button. Add an “=” before each and you can count, add, or average any range of cells that you select. These are essential building blocks to know for the next tip.
9. IF and IFS
Add IF or IFS after Sum, Average, and Count to add some criteria to those formulas. Adding the “S” allows you to attach multiple criteria to the formula. Let’s say I have a table full of quality scores and I want to count how many perfect 100% scores my team earned. My formula would look something like this:
=COUNTIF(A1:A500,“100”)
10. IF Statements
IF statements allow you to apply logic to a certain cell. For example, if you have a list of all of your phone calls and a column that displays how many seconds each caller waited before their call was answered, you can determine how many calls were answered in less than 60 seconds. Your formula would look something like this:
=IF(A2<=60,“Yes”,“No”)
So if the caller waited 60 seconds or less, the value printed in the cell will be “Yes.” If it was more than 60 seconds, the value would be “No.”
That’s ten rather amazing tools to supercharge the way you use Microsoft Excel or Google Sheets for your reporting and we barely scratched the surface of some of the things you can do. A rule of thumb I’ve learned with these programs is that if there’s something you’re doing manually that’s time consuming, there’s probably a formula or function that will help you do it faster
What are your go to Excel tips and tricks? Leave us a comment and let us know.
-
3
-
3
-
-
Download the free Public version
-
Both the Bar and the Column charts display data using rectangular bars where the length of the bar is proportional to the data value. Both are used to compare two or more values. However, their difference lies in their orientation. A Bar chart is oriented horizontally whereas the Column chart is oriented vertically.
Bar Chart

Column chart

Which one to choose from and why ?


 There are tons of shortcuts for Excel out there—here’s a list of 200 for Excel 2013 alone. But trying to learn such a large number can be overwhelming, confusing, and ultimately inefficient.


 For data analysis and interactive, exploratory computing and data visualization, Python will inevitably draw comparisons with the many other domain-specific open source and commercial programming languages and tools in wide use, such as R, MATLAB, SAS, Stata, and others. In recent years, Python’s improved library support (primarily pandas) has made it a strong alternative for data manipulation tasks. Combined with Python’s strength in general purpose programming, it is an excellent choice as a single language for building data-centric applications
 NumPy, short for Numerical Python, is the foundational package for scientific computing in Python. It provides, among other things
 pandas provides rich data structures and functions designed to make working with structured data fast, easy, and expressive. It is, as you will see, one of the critical ingredients enabling Python to be a powerful and productive data analysis environment. The primary object in pandas that will be used is the DataFrame, a two dimensional tabular, column-oriented data structure with both row and column labels:
 matplotlib is the most popular Python library for producing plots and other 2D data visualizations. It was originally created by John D. Hunter (JDH) and is now maintained by a large team of developers. It is well-suited for creating plots suitable for publication. It integrates well with IPython (see below), thus providing a comfortable interactive environment for plotting and exploring data. The plots are also interactive; you can zoom in on a section of the plot and pan around the plot using the toolbar in the plot window.
 IPython is the component in the standard scientific Python toolset that ties everything together. It provides a robust and productive environment for interactive and exploratory computing. It is an enhanced Python shell designed to accelerate the writing, testing, and debugging of Python code. It is particularly useful for interactively working with data and visualizing data with matplotlib. IPython is usually involved with the majority of my Python work, including running, debugging, and testing code. Aside from the standard terminal-based IPython shell, the project also provides
 SciPy is a collection of packages addressing a number of different standard problem domains in scientific computing. Here is a sampling of the packages included:

 Filtering allows you to quickly sort any column and include/exclude rows containing certain data. For example, if you have a list of all of your phone calls for the month, you can use filtering to only display the calls handled by certain agents.
 Conditional Formatting is a great way to add visuals to your spreadsheets based on the data. For example, if you want to rank a set of data, you can have all rows within a certain parameter be one color and anything outside of that parameter another color. It’s great for seeing where you’re hitting your goals and where you might need to improve.
 The format painter is a simple tool that allows you to copy just the formatting from a certain spreadsheet and quickly apply it to a new set of cells.
 The dollar sign is an important little symbol to remember in your formulas. In the previous point, Excel has the ability to customize the formula in the cell relative to the row it’s in. Perhaps you’re doing a formula where you want to multiply the cells in a particular column by a value in another single cell. The dollar sign turns off that relativity and makes sure that the cell number doesn’t change in your formula. So your formula might look something like :
 Data Validation allows you to create cool things like drop down lists in a cell. Consider a time where you had to enter “yes” or “no” in a certain column or possibly a wider range of options. A drop down list allows you to quickly select from the options you want in a couple clicks rather than several key strokes and it ensures consistent formatting.


Introduction
in Introduction Zone
Posted
Welcome @Martin Chay
Nice to hear from you .. may be we will have some examples from your side too
Yes we will have statistics but at later stage....