How to Choose the Right Visualization for your Excel Data

Entry posted by Christopher Chin in Data Visualization
24,421 views
Introduction
Excel is the staple spreadsheet program of the business world for data recording, manipulation, and analysis. And it is also one of the best tools to generate graphs and charts for reporting.
But the plethora of chart options available might be daunting for the first-time viewer: from pies and waterfalls to histograms and scatterplots, which graph should you choose and for what use cases?
In this article, I will explain the four most commonly encountered datasets and what charts are most effective for each one. It may be tempting to choose based on what “looks best” or even based on Excel’s “Recommended Charts” option, but understanding the science behind data visualization will help you much more effectively communicate insights to your audience.
I. Trend over Time In one Metric
The first commonly encountered dataset consists of time in one column and a metric in the second column. You are trying to track the trend in a particular quantity over time (e.g. sales over the fiscal year).

To find charts Excel recommends for this data, execute the following:
- First, insert your data in an Excel sheet.
- Highlight the data, navigate to the “Insert” tab in the ribbon at the top, then click “Recommended Charts”

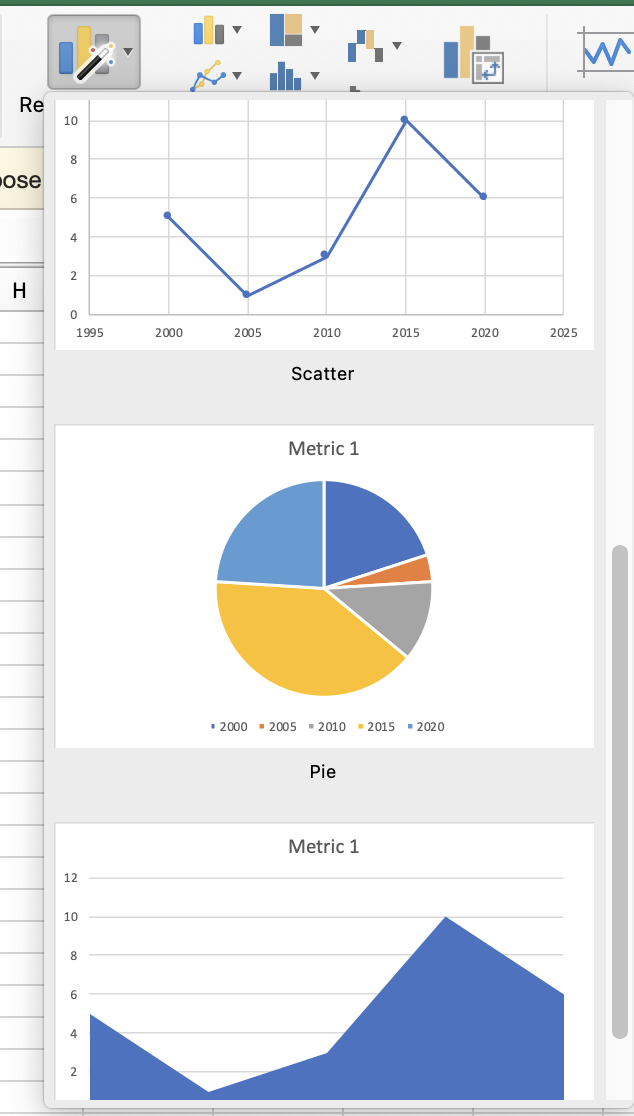
For this dataset, Excel recommends a line, column pie, and area chart.
As a general rule, whenever you are showing “Trends over Time”, use a line chart.

More than any other chart, line charts can show an overall, smoothly connected trend at a glance. Column charts cannot because the columns are disconnected. Pie charts cannot because they cannot show time linearly. And area charts, while aesthetically pleasing, add extra unnecessary color and weight to a visual when all you need is a simply and clearly stated line.
II. Trend Over Time in Many Metrics
The second commonly encountered dataset consists of time in one column and several metrics in adjacent columns. You are trying to track changes in multiple quantities over time (e.g. heart rate, blood pressure, etc. over an hour)

For this dataset, Excel recommends many different options, including a bubble plot, stacked bar, and stacked area chart.

Following our previous rule, since we are showing “Trends over Time”, a line chart is the best option.
The bubble plot is ideal for comparing three dimensions simultaneously (via x axis, y axis, and bubble size), and unnecessarily complicated for our purposes. The stacked charts are also overly complex, and that complexity serves to muddle the trends rather than enhance them.

Note how the line chart makes it easy to see how each category relates to the others at each point in time.
III. Compare Categories across one Metric
The third commonly encountered dataset consists of categories in one column and a metric in the second column. You are trying to evaluate how different categories compare with respect to a certain metric (e.g. votes for different candidates).

For this dataset, Excel recommends a column, pie, and bar chart.

As a general rule, whenever you are “Comparing Categories”, use a bar chart.

More than any other chart, bar charts can enable easy visual comparisons at a glance. A pie chart would not be appropriate because these categories are not parts of a whole.
And, while a column chart could also fit the data, it is best practice to only use a column chart if the horizontal x-axis represents time. This is because audiences are accustomed to reading time from left to right. Be consistent by only representing time horizontally from left to right and only representing categories vertically from top to bottom. Through that consistency, your audiences will be able to much more quickly and easily digest your visualizations.
IV. Compare Categories for Parts of a Whole
The fourth and last commonly encountered dataset consist of categories and percentages in the second column that add up to 100%. You are trying to evaluate how different categories compare with respect to a certain metric as parts of a larger whole (e.g. percent of people that agree/disagree/remain neutral on a survey).

For this dataset, Excel recommends a pie, column, and bar chart.

Following our previous rule, since we are “Comparing Categories”, a bar chart is the best option.
Your instinct may be to use a pie chart since pie charts typically specialize in showing parts-of-whole relationships. However, when the total number of parts exceeds about 2 or 3, the number of slices, colors, legend entries, and/or data labels becomes unwieldy and unnecessarily noisy for the viewer.
Bar charts much more cleanly express the same parts-of-whole relationship, which can be enhanced by attaching data labels at the end of each bar to emphasize each bar’s role as a percentage of the total.

Summary
There are many more types of datasets and chart types but these are the ones that will have the widest applicability in your work. To summarize, remember these 2 golden rules:
- When your data shows “Trends Over Time” (for one or multiple metrics), use a line chart
- When your data “Compares Categories” (across a metric or for parts of a whole), use a bar chart
-
 3
3


0 Comments
Recommended Comments
There are no comments to display.